Nonlinear least-squares fitting is used to fit a nonlinear equation to a data set. Accompanying this problem is a hypothetical data set that appears to be a hyperbolic curve. Hyperbolic curves are described by equations of the form:
Fit the equation above to these data calculating values for
a and
b as well as the correlation coefficient,
r2.
Show Answer
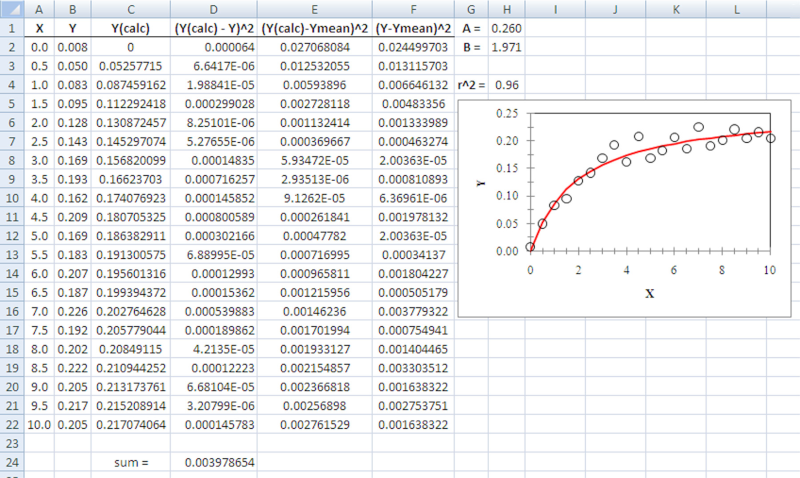
The values of a and b are 0.260 and 1.971, respectively. The value of the correlation coefficient r2 is 0.96. A example of the spreadsheet used to calculate these values is shown below.
The equations for key cells are as follows:
| Cell |
Equation |
| C2 |
=($H$1*A2)/($H$2+A2) |
| D2 |
=(C2-B2)^2 |
| D24 |
=SUM(D2:D22) |
| E2 |
=(C2-AVERAGE($B$2:$B$22))^2 |
| F2 |
=(B2-AVERAGE($B$2:$B$22))^2 |
| H4 |
=SUM(E2:E22)/SUM(F2:F22) |